Some of you will remember that I planned a “System Diagram” in Plain! That was a block of configuration code that tied event on modules together. This is exactly what I plan to use UML State Diagrams for.
 In this diagram we generate a Temp Changed event on one device that is sent to a Display on another device. UML State Diagrams are excellent for visualizing this event flow, but also capable to showing more detailed flow. What UML State Diagrams can not do is to visualize logic very well, so for that I use PLD or simply direct source code.
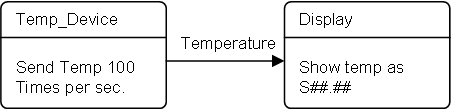
Lets forget about the internal logic in the two devices for now. We have one device that sample temperature 100 times per sec, a second unit that is capable of receiving and displaying temperature. The diagram simply say that as the temperature event is generated it will be sent to the display.
Temperature
- – time stamp
- – temperature
In this example we use easyIPC, so all the code we actually need is a “Wire” command at startup that is sent from “System Master” to Temp. Device:
- Look up address of Display Device
- Send Wire Temp_Device.Temperature to Display.TempInput
This will cause the Temp_Device to start sending Temperature messages 100 times a sec to Display. Now, sending temperature 100 timer per sec is a bit overkill, so we modify the diagram a little. In this case I add a smoothing function in. Smoothing is a pre-defined function in code, so all I need to do is to create the state and route temperature in and set smoothing Window to 2 sec with 1 sec output frequency. Smoothing is in effect average, so what this does is that we send the average temperature for the last 2 seconds every second.
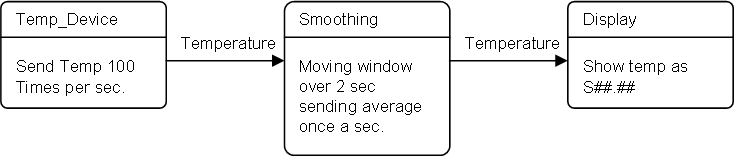
Generated code will be something like this on the System Master at start-up:
- Look up address of Display Device
- Look up address of Smoothing function
- Send Wire Temp_Device.Temperature to Temp_Device.Smoothing.Input
- Send Wire Temp_Device.Smoothing.Output to Display.Tempinput
This example is highly simplified, but it illustrates top level UML State Diagram usage that can’t be covered that easily in other techniques.